Nothing big or clever this time. (Is it ever big or clever here?) Just a little trick that I find useful occasionally, that might be of use to you too.
Picture the scene – you’re debugging some code in your IDE and you realise that you want to take a snapshot of lots of state (e.g. all the properties of an object), or of state that’s deeply buried down in an object hierarchy. You want the snapshot from this debugging session so that you can refer back to it in your next debugging session.
For instance, you’ve just realised that the problem is with the 11th iteration around a loop, but you realise this when you get to the 12th iteration. You want to quickly capture how things are during the 12th iteration, so that when you start again and get to the 11th iteration, you can compare how things are then with the snapshot.
There might be ways to do this purely within your IDE, but I found the standard Windows 10 screen grab tool Snip & Sketch very handy for a quick and dirty result. A key part is its feature that lets you kick off a screen grab for N seconds into the future:
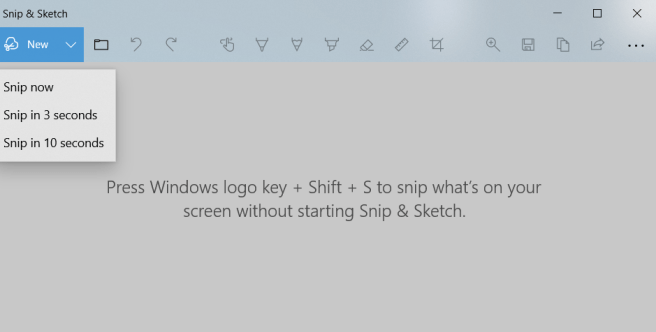
You select e.g. Snip in 10 seconds, then switch to your IDE. You then hover over the object whose state you want to capture, expanding elements as necessary to get to the right part. When the 10 seconds elapses Snip & Sketch temporarily takes over the screen, and so it freezes in place all the tooltips and other temporary screen elements that have popped up showing the state of things.
You can then draw a box around the tooltips that show the information that you want:
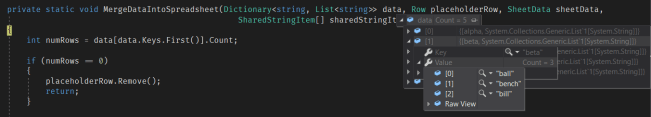
In this example I hovered over the data parameter, then clicked on its element 1, then on the Value property. This is a list of three strings: ball, bench and bill. Depending on what I wanted, I might draw a box around just the top-most box of state, showing the list of strings. The screen grab then just hangs around as the content of the Snip & Sketch window, which I can refer to during my next debugging session.
This isn’t perfect in every circumstance, for instance when there are too many things to on the screen at once – e.g. if there 103 strings in the list rather than just 3. However, I’ve found it a useful tool for some situations, that’s quick and easy to use. As it works purely on the contents of the screen, it will work with any IDE that displays useful information to the screen. I hope you find it useful.

I do abhor receiving screenshots unless accompanied by other information, but they do have a wow factor, and sometimes things like screen recordings are desirable.
I think windows and linux let their users down in this regard because their tools are not as simple as the Mac. It’s one of the only things I think Apple does well
LikeLike
I agree Lewis – I have to fight my irritation when someone sends a screen shot with 0 context as if I’m able to read their mind via the screen shot. They haven’t been bothered to explain things. The way I find screen shots can be helpful is a quick way to take a note for my own benefit, while debugging. I then throw it away when I’ve finished.
LikeLiked by 1 person