This is a silly little bit of data crunching and very limited visualisation, based on the names of artists who have been in the UK music charts. I fancied using R for a change and also trying out notebooks (I’ll explain both a bit below), and this seemed to be about the right size and type of project to do that.
The data
I downloaded the data on 27th July 2020 from the UK music charts website. I mention the date because this is data that will change over time, so if you try to reproduce my results you will need to exclude changes to the data since then if you want to get exactly the same output.
Because it’s too much like hard work, I’m limiting this to just artists’ names. I’m ignoring when they had hits, the number of weeks in the charts, highest position, genre etc. Scraping the data for just the names was tedious enough without adding this detail.
Another thing that made getting the data tedious was its quality. Fortunately it’s all upper case, but there were still duplicates. For instance, Cher recorded with both Beavis and Butthead and Beavis and Butt-Head (with a hyphen). I was grateful that all the duplicates for a given artist shared an id, so I was able to remove duplicates using that. This isn’t in the R code, as I did it with a combination of Excel and Notepad++ (a guest podcast I did on Boagworld).
There are some bands missing, because I went via the alphabetical index (which has an extra section for names starting with a number). For example, the band !!! doesn’t appear in this index, even though you can go to it directly – I haven’t included it.
The list of artists with duplicates removed can be downloaded.
R
You might not have come across the programming language R before. It started as an open source alternative to the statistics processing language S. It’s used a lot by science PhD students to crunch their results, and also for doing data science. The other main data science language is Python, named after Monty Python.
R is similar to SQL in that it’s designed to operate over sets of data. You typically issue one command in R and that will go off and do something to everything in a set, for instance check each member to see if it’s bigger than 5. Unlike in some languages, you don’t explicitly instruct the computer to start at the beginning of the set, move from one thing to the next, and stop at the end.
Like with cursors in SQL, you can do explicit loops like this in R, but (also like SQL cursors) it’s usually much slower than doing things the way the language prefers – letting the computer handle loops behind the scenes. In fact, the similarity between SQL and R means that databases such as Microsoft’s SQL Server have in recent years started allowing you to use R to manipulate data rather than just using SQL.
Notebooks
Notebooks are a container for code written in languages like R and Python. They’re a bit like spreadsheets in that one notebook can contain a mix of code, text and outputs such as graphs and charts. They’re not identical to spreadsheets – in a notebook the code is visible rather than hidden away, and you can’t just dump data into a notebook like you can into a spreadsheet. The closest you can come is to use some code to create or import data into a variable.
You don’t need to use notebooks to program in something like R. You could use a text editor to edit your code and the engine that understands R from the command line, or an IDE such as RStudio.
Physically, the notebook is a text file. This text file is interpreted by the notebook software and turned into a web page. You use this web page to edit and run your code. When you run the code, the notebook software sends the notebook to the R engine behind the scenes on your behalf, and sends any errors or output from the R engine back to the web page.
So, to use a notebook you need:
- The notebook itself (the text file)
- An engine for your language (R, Python etc.)
- Notebook software that understands how to translate a notebook between the text file and its web representation, and to act as plumbing between the web representation and the language’s engine.
This picture shows a bit of the notebook I wrote while preparing this post, as displayed in my web browser. The top part shows the controls for editing and running the notebook. From Display results downwards is the notebook itself. There’s a bit of text (the heading Display results), a bit of code and then a graph produced by running that bit of code (in particular the lines at the bottom, starting ggplot).
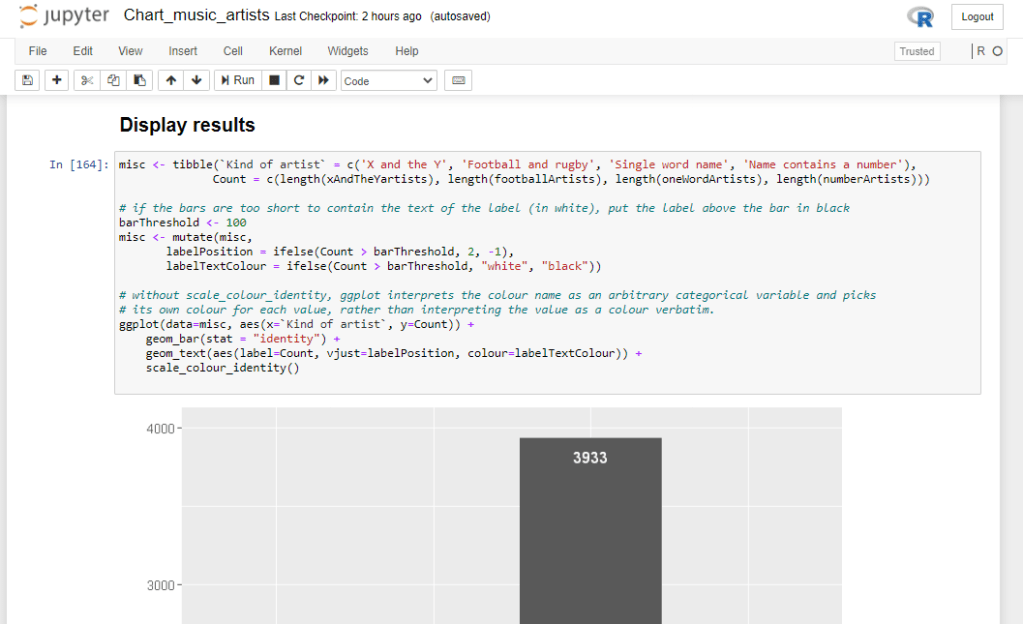
If you would like to look at the whole of the notebook you can download it.
Crunching the data
With that introduction out of the way, what did I do to the data? I didn’t set out with any plan in mind, but just noticed things about the data as I poked around in it, which raised questions that I couldn’t answer simply. The posh term for this is Exploratory Data Analysis. In many ways I think it’s similar to (non-automated) software testing – you have a general intention in mind, but let your curiosity guide you, helped by tools, skill and experience.
Much of this is simple analysis using regular expressions. I wanted to count how many artists:
- Had names of the form X and the Y, like Mari Wilson and the Wilsations or Nick Cave and the Bad Seeds;
- Were professional football or rugby teams;
- Had names that were a single word, like Blur;
- Had a number in their name.
The last one was a bit fiddly. Some artists, like Twenty One Pilots, had their numbers spelled out as words, but I didn’t want to count bands with names that just included words like money (which includes one). Fortunately, I didn’t have to list infinitely many spelled numbers. To recognise a name with digits in it, I didn’t have to list out all numbers between minus infinity and infinity – I just needed to list all the components that any number could be built from (the digits 0-9). Similarly, to recognise the words for numbers I just needed to list all the component words that numbers could be built from – e.g. eighty and one and not eighty one.
Other artists, like Soul II Soul, had their numbers in Roman numerals. This gets a bit tricky, because while e.g. D is a Roman numeral it’s also often someone’s initial. So I decided not to include I, V, or numbers beyond X as they would more likely be letters than numbers.
Collaborations
One bit of crunching was about half the total, so I’m talking about it separately from the rest. I wanted to find artists that were collaborations of two or more named artists e.g. Arthur Baker vs New Order. I wanted to see how many artists were never in the charts in collaborations like this, how many were in the charts only as part of a collaboration, and how many were in the charts on their own and in a collaboration.
This highlights a theme of pretty much all real world data processing. The data is messy (because the real world is messy), and isn’t always in the form you want it to be in. What I would really like is a reliable way of telling that an artist was a collaboration, and the names of the separate collaborators. A bit like the people who work together on a film, as shown on IMDB. But IMDB takes more effort to maintain and was designed to support analysis like this. I’m stretching the UK Charts data when I’m expecting it to answer this kind of question. So, since I don’t have such reliable help, I’ve had to guess and make compromises.
Some bits of text seemed a fairly safe bet: /, versus, vs, featuring, feat, ft. Other things, like and, were less reliable – Apes, pigs and spacemen is the name of one band rather than a collaboration of two or three, but Afrika Bambaataa and James Brown is a collaboration between an old school hip hop MC and the godfather of soul. Similarly, Cosby Stills Nash and Young has no commas, so it looks like Cosby Stills Nash collaborated with Young. The compromise I took was to assume that comma and and split up collaborators, and the lack of any magic bits of text meant that it was just one artist.
General considerations for data processing
So please take this bit of the analysis as even more loosely based on reality than all the rest (which already isn’t 100% accurate, for similar reasons). Also, please bear this in mind when you look at some charts or hear some statistics. You usually don’t get to see below stairs (as it were), and see the servants scurrying about in the data kitchen, cursing the state of the data, stressing over what compromises to make and why, but please remember that this is usually how data is prepared.
I guess that this bit of the analysis raises some interesting questions (as does the football teams one). What is a band? If the band changes its membership over time, is that the same band or a different one? What if it splinters – which one is the real one? (Like a codebase forking, as happened with Hudson and Jenkins.)
A football team changes its personnel over time – is today’s side the same side as the one from ten years ago or a different one? I guess the answer is: yes and no. It’s hard to represent such subtlety in a computer, the charts database didn’t bother, and I’m not bothering to try to reconstruct it. It’s interesting that some of the football teams in the charts had their year in the artist’s name, like 1996 Man Utd F.A. Cup Squad.
Charts of the charts
Just as the description of the analysis was split up into collaboration and the rest, the charts are also split up that way. This is only because of the numbers involved and wanting charts to be easy to read (as you’ll see below).
This is a chart showing the various kinds of name:

Single word names are much more common than anything else, which is to be expected I think. The slight surprise was X and the Y is about the same size as contains a number. The smallest was football and rugby teams, and it surprised me how few there were. I guess they stick in the memory more than most artists and so you think there were more of them than there really were. Note that these groups overlap – for instance, NewOrderEngland is a both a football artist and a single word.
This is a chart showing collaborations:

Subject to the wooliness I mentioned earlier, these groups shouldn’t overlap. I wasn’t expecting this data to be one way or another, so I’m not surprised by how it turned out.
Summing up
R is quite a nice language for crunching data, and notebooks are a nice way of using R and other languages. If you do use R, I recommend you start with the tidyverse, which is a subset that’s relatively easy to use because it follows consistent rules for how things should work, and names things fairly sensibly. If you feel like getting started with R, I really recommend:
- Instructions on how to download Jupyter (the notebook software)
- R for Data Science – a book which is available for free as a website, co-written by Hadley Wickham, one of the prime movers behind the tidyverse. Unusually for a technical book, It’s written with the reader in mind, and lays things out sensibly and clearly. It assumes you use RStudio rather than a notebook, but that’s not a big deal.
Also, data processing is in some ways a form of engineering. There are competing concerns that must be weighed against each other. Please don’t be fooled by stats whitewash – question where the data came from and how it has been processed since then.

I did not know Jupyter was available off of Python, but it’s very cool
LikeLike
You can go further down the non-Python notebooks rabbit hole if you want. .Net Interactive integrates .Net Core and Jupyter, so you can use C#, F# or PowerShell
PowerShell + notebooks isn’t something I’ve tried, but seems like a very cool way to do e.g. DBA-type support, because you can save the scripts you ran, the results you got back and text notes in one document, and then e.g. attach it to a support ticket. Someone with a much more impressive beard (and DBA skills) than mine explains: https://channel9.msdn.com/Shows/Data-Exposed/Jupyter-Launch-NET-Interactive-Notebooks–Data-Exposed-MVP-Edition?ocid=player
More on the general .Net / Jupyter integration:
https://www.hanselman.com/blog/AnnouncingNETInteractiveTryNETIncludesNETNotebooksAndMore.aspx
LikeLike