I was catching up with old episodes of the Radiolab podcast, and one on Coronavirus and numbers made me think about risks to do with Coronavirus, and that thought expanded out to risk more generally and also how it can apply to software testing.
UK Coronavirus numbers
I need to prefix all this with quite a lot of caveats. I am using official UK data (downloaded from https://coronavirus.data.gov.uk), but even so the analysis below isn’t wholly reliable. For a start, I will be looking at only deaths, and no other consequence of Coronavirus. So I will be ignoring really important things, such as people being seriously ill in hospital, people having long term physical and / or mental health problems, the effect on people’s jobs (and hence their physical and mental health) and so on. I am also ignoring systemic effects, like the effect of where someone lives, how old they are, any underlying health conditions they have etc.
Another thing I am ignoring is any concerns about how the data is collected, such as double-counting tests, the number of false positives or negatives in the tests etc. Finally, I will be lumping together cases per day and deaths per day, which I know to be wrong but I can’t think of a reliable alternative. The cases reported on a given date are reasonably reliably associated with that date. However, the deaths on a given date could be linked with a positive Coronavirus diagnosis at any point in the previous 28 days. I.e. a sudden peak in infection would show up reasonably quickly and clearly in the cases data, but the peak in the deaths data would lag and be smeared out over days.
With all that said, here are two graphs. Neither of them is particularly clear, but they’re two attempts to combine two data sets: cases over time and deaths over time. If you look at the official UK Coronavirus graphs online, you’ll see that the deaths graph rises and then drops and stays close to zero. However, the cases graph rises, drops and has recently started rising again (so far, without a matching rise in deaths).
The first graph was produced in Excel, and shows a fairly transparent circle per day where:
- The height of the centre of the circle shows the number of new cases that day
- The size of the circle shows the number of deaths that day divided by the number of cases that day, i.e. how lethal Coronavirus is or its mortality rate. Where the number of deaths per day is zero, I’ve arbitrarily set the size of the circle to be very small, so that the circle doesn’t disappear completely.
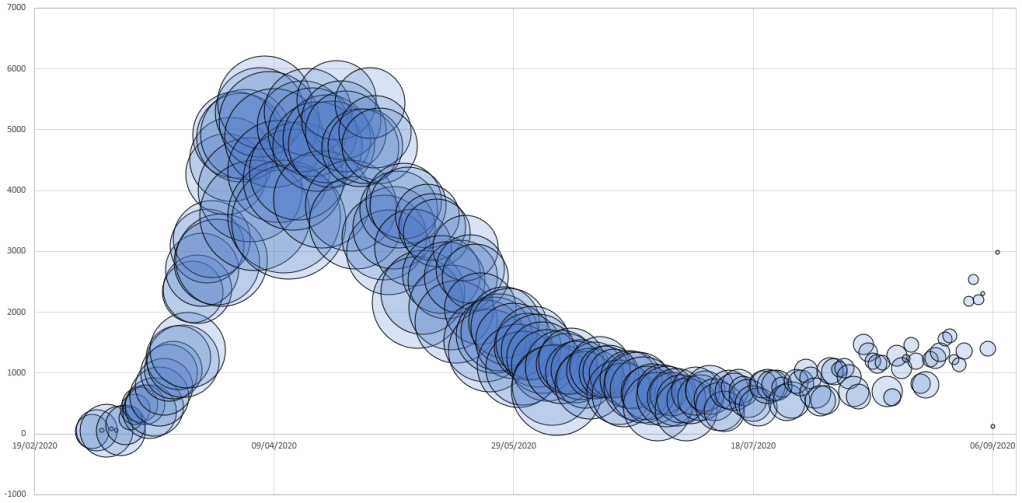
You can see the heights of the circles follow the cases graph – rising sharply, falling a bit less slowly, tailing off and then rising again. The size of the circles increases, decreases and generally keeps decreasing, although the decrease seems to lag behind the decrease in cases. The most recent bit of the graph can be interpreted in either a glass half full or a glass half empty kind of way:
- Half full: The number of deaths hasn’t risen even though the number of cases has
- Half empty: The number of cases has risen a lot
What’s caused the rise in cases with no corresponding rise in deaths is beyond me.
This second graph shows the same data but in a different way, and was generated by ggplot2 in R. In this graph, all circles are the same size (they’re just points of constant size), but their colour varies with date. Dark blue circles are the oldest, then light blue, green, yellow, and finally orange. The x axis shows cases and the y axis shows deaths divided by cases (mortality rate).
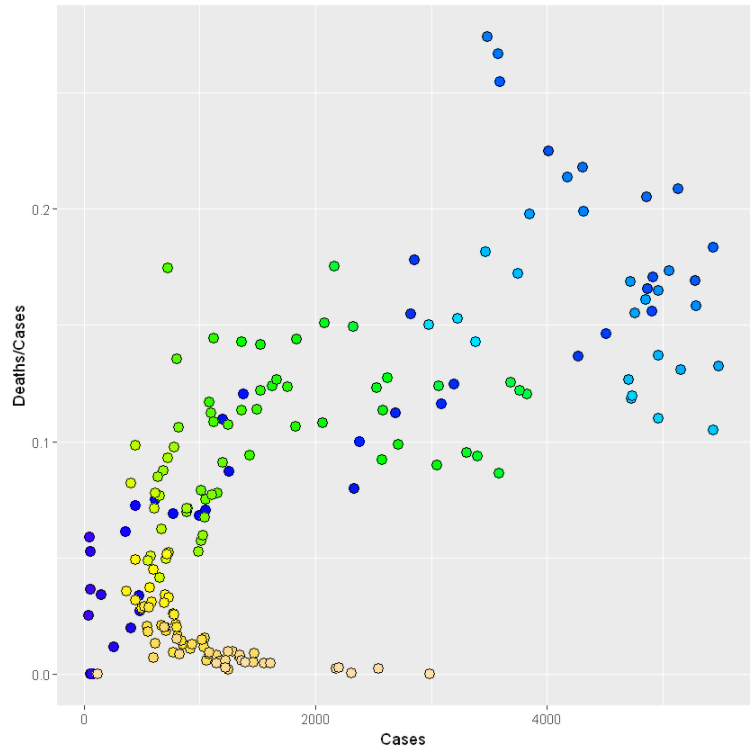
It’s a bit hard to see difference within a colour, but the dark blue points climb quickly from the bottom left to the top right. Then as the points change to light blue, they start to fall back generally in a down and left direction, which continues as they turn green and then yellow. Yellow to orange is the interesting part – cases are increasing (the points move to the right) even though mortality rate continues to drop. The last point is back to half way along the x axis, even though it is at the bottom of the y axis.
The two axes of risk
The reason why I produced the second graph is to highlight how it’s sometimes useful to describe risks in terms of two dimensions:
- How likely it is
- How bad it is if it happens
These correspond to the two axes of the second graph, i.e. you can think of the second graph as showing risk.
If you continue to take the same very hand-waving approach that I flagged up earlier, the number of cases is a proxy for how likely you are to catch Coronavirus. (I stress: this ignores a lot of important things that will influence an individual’s risk, but I think this is still helpful.)
How bad Coronavirus can also vary a lot between people – thankfully not everyone who has caught it has died. (Again, I’m aware I’m ignoring many very important things here. Again, I think it’s still helpful.) It’s worth remembering that the y axis in the second graph isn’t simply deaths, it’s deaths / cases. If Coronavirus stayed as lethal as it was at the start, as the number of cases climbed towards the end of the data, the number of deaths should also climb. However, for reasons I can only guess at, Coronavirus is less lethal than it was before.
If you look at the graph, the best place to be is the bottom left corner – it’s unlikely that the bad thing will happen, and even if it did happen it wouldn’t be too bad. The worst place to be is the top right corner – the bad thing is more likely and if it does happen it will be bad. The next worst place (in terms of individual people) is probably the top left – it’s unlikely the bad thing will happen, but if it does happen to you that is bad news. This compares to the bottom right – it’s likely that the bad thing will happen but it won’t be too bad if it does.
You can apply this kind of analysis to other things, such as building hospitals, driving a car or (as I’ll go into shortly) testing software. In terms of driving a car, consider the risk of being injured in an accident. Among the many things you could do, there are three that act in different ways:
- Having daylight running lights reduces the risk that an accident will happen, as it makes it more likely that other road users will see you and so avoid you. If you do still crash, daylight running lights will do nothing to make the crash better or worse. You can think of daylight running lights as moving the point in the risk graph to the left (from more likely to less likely).
- Having your seatbelt on does nothing to reduce the risk that an accident will happen – in fact, the sense of safety it produces in you might encourage you to more risky driving. However, should an accident happen, it will probably reduce how bad that accident will be. Seatbelts move the point in the risk graph downwards (from bad to less bad) – I’m assuming you’re a sensible driver.
- Slowing down reduces both the risk of having an accident and how bad it would be if it did happen. It moves the point in the risk graph down and left.
So, when you have a list of risks to consider you have a few options:
- Accept the risk as it is.
- Make the risk someone else’s problem to deal with.
- Make the risk less likely to happen.
- Make the risk less harmful if it does happen.
- Both of the previous two.
Testing software
In any decent-sized bit of software, this is usually more to test than will fit into the time available. So, you need to decide how to ration your testing time. There are several approaches to this, and one is based on risk. It requires a small amount of mental gymnastics, similar to taking the absolute value of numbers so that positive and negative numbers all end up being positive, but is still not too tricky and can be very useful.
You think of all the bad things that might happen when people use the software. You also think of all the good things that users could get out of using the software. For each of those things, you think about:
- How likely is this to happen?
- How bad would it be if either the thing happened (if it’s bad) or it didn’t happen (if it’s good)?
The second bit is the analogue of taking the absolute value of the size of the good / bad. It will probably be hard to put numbers to all this, but guessed-at relative numbers are still much better than no numbers.
This lets you plot out all the things you thought of in a graph similar to the second one above. You can then use the graph to put an order to the things:
- Top right things get attention first. They’re likely to happen, and if they do / don’t it will be a big deal.
- Top left things probably get attention next. They’re less likely to happen, but if they do it will be a big deal.
- Bottom right things are probably third.
- Bottom left things are definitely last.
An example of a top right thing is a valid user being able to log in to a website (a very good thing that’s likely to happen and so is very bad if it can’t). An example of a top left thing is a computer-controlled medical device harming a patient (an unlikely but bad thing). An example of a bottom right thing is a user changing their photo on their profile page (likely but not a big deal if it doesn’t happen).
Summary
I hope that you and those whom you love are and stay safe from Coronavirus. There are steps you can take to reduce the risk of catching Coronavirus, such as washing your hands, keeping distance from others etc. There are also things you can do to help other people reduce their risk of catching Coronavirus, such as covering your mouth and nose when you’re indoors, and keeping distance from others. In general, it can be helpful to analyse risks in terms of how likely they are and how bad it would be if they happened. This can be a useful way to work out how to spend time when testing software.

‘ What’s caused the rise in cases with no corresponding rise in deaths is beyond me. ’
As I understand it, coronavirus cases are now most common in younger, healthier people compared to before. This is due to more vulnerable people deliberately keeping separate from others, and younger people returning to more normal lifestyle. So the virus itself isn’t necessarily less lethal, but those infected are more likely to survive.
LikeLiked by 1 person
‘What’s caused the rise in cases with no corresponding rise in deaths is beyond me.‘
The new cases are mostly in younger people, who are more likely to survive.
LikeLiked by 1 person
Risk encompasses many things. Likelihood, Impact, but also consider Severity (on a national scale sadly individual death is not the highest severity), prevalence and controls.
As usual a good read, well tied in to software with lovely visualizations. Hope you are well Bob
LikeLiked by 1 person
@P and @psalmondev I think that this highlights one of the many important things I’m glossing over. There are effectively many separate sub-populations (by age, underlying health conditions, housing density, riskiness of job etc.) each with their own statistics. Plus these sub-populations are jumbled on top of each other in terms of social contact and being in the same physical spaces as each other.
The national statistics are a blend of all these sub-populations’ and it’s risky to pretend that things for an individual are as simple as the national statistics imply.
LikeLike
@Lewis – thank you, I’d vaguely heard of some of those terms but your comment prompted me to search for them to understand them better. It’s interesting to see what kinds of people write risk stuff that Google returns in the search results:
Health – https://www.healthknowledge.org.uk/public-health-textbook/research-methods/1a-epidemiology/numerators-denominators-populations
Aviation safety – http://aviationsafetyblog.asms-pro.com/blog/how-to-define-severity-and-likelihood-criteria-on-your-risk-matrix
Management – https://www.schgroup.com/resource/blog-post/risk-and-control-matrix-a-powerful-tool-to-understand-and-optimize-your-organizations-risk-profile/
LikeLike