Nim is a simple game for two people. In this article I will describe it in case you don’t know it (or don’t know this version of it), and then describe how I’ve modelled it in a C# program and what I learned about the game as a result.
The game
There is a simple board with 3 lines on it – a short one, a medium-sized one and a long one. The lines have places on where counters can be – the longest line has 5 places, the medium line has 4 and the shortest has 3. The game starts with a counter on each place. The two players take it in turns to take 1 or more counters off the board. All the counters removed in a turn must be next to each other on the same line. (This means that the most counters that can be taken in 1 turn is 5 – all of the counters on the longest line.) A player wins by forcing their opponent to take the last piece.

Given that you always have to take at least 1 counter, and there are 12 counters on the board at the start, the longest game takes 12 moves. There are no draws, and no stalemates that go on forever. The shortest game is 4 moves (2 for each player). An example of this shortest game, between players A and B, is:
- A takes all the counters from the line with 5 counters on
- B takes all the counters from the line with 4 counters on
- A takes 2 of the counters from the line with 3 counters on (leaving only 1)
- B has to take the last counter from the line that started with 3, and so loses
Modelling the game
Before writing any code, you have to decide how the board and moves will be modelled. This is where it gets embarrassing – I’ve been trying to do this for a long time, and failed repeatedly. The models I picked were too complex, and so the programs I wrote based on them took a while to write and far too long to run. I recently explained the game to a friend, and that evening it just clicked.
The important thing to realise is which detail we can ignore, so what’s left is simpler. If the board ended up looking like any of these, the game would continue in the same way. I.e. there’s no meaningful difference between these versions of the board:
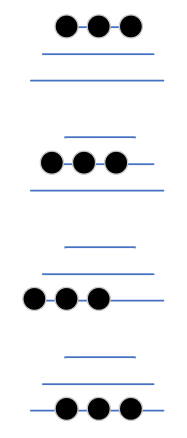
The important information is how many runs of 5 adjacent counters there are (0 or 1), how many runs of 4 adjacent counters there are (0, 1 or 2) and so on. This means we can represent the board as 5 numbers: how many runs of 5 adjacent counters there are, down to how many counters are on their own (i.e. they’re runs of 1 counter). Through just trying all the possibilities, you can find out that the maximum number of runs of different lengths are:
- 5 counters – 1
- 4 counters – 2
- 3 counters – 3
- 2 counters – 4
- 1 counter – 7
Once I had realised that the board could be described as 5 numbers, and the biggest any of those numbers could be is 7, I further realised that I could treat them as digits of a bigger number. I.e. instead of 10213 meaning 1 x 10,000 + 0 x 1,000 + 2 x 100 + 1 x 10 + 3 x 1 as it normally does, it could mean 1 run of 5 counters, 0 runs of 4 counters, 2 runs of 3 counters, 1 run of 2 counters and 3 counters on their own (3 runs of 1). (Not all possible numbers are valid Nim boards – 19999 is invalid, for example – but that’s OK as we won’t encounter these invalid numbers if we do things properly.)
Doing it this way meant that the game would start as the number 11100. Each move would make the overall number decrease, even if digits towards the right of the number might increase. For instance, taking the middle counter from the row of 5 would mean the board became 01120 – the number of runs of 2 has gone up from 0 to 2. However, the overall number has gone down – from 11100 to 01120. A player would lose when the board was 00001 (assuming no player would, for instance, take both counters if there were 2 next to each other and no other counters).
This trick of representing the state of the world as a positive integer that could only decrease, and things stopping at or near 0, is one I is something I learned from Asa Butterfield’s character in the film X+Y.
Now that the board is represented in a useful way, what about moves? Each move will reduce by 1 the number of runs there are of a particular length, for instance it could reduce the number of runs of 3 by 1. If all counters in that run are removed, that’s all that happens. For instance, if a player takes away all 4 counters from the line with 4 in, the number of runs of 4 goes down by 1. If, however, the player takes away some but not all of the counters in a run, the number of one or more shorter runs will increase. For instance, taking the end 2 counters from the run of 5 will reduce the number of runs of 5 by 1, and increase the number of runs of 3 by 1.
I tested out the model on paper first, then in a spreadsheet, and finally wrote it up as some C# code. The code is available on GitHub and I describe it briefly below.
Analysis
There are 101 different states that the board can be in, and these can be arranged into 746,062 possible games. I already knew from playing the game that even though there’s only 1 losing state for the board (00001), there are other states you can get into before that where it’s inevitable who will win and who will lose. If there are only runs of 1 left (just counters on their own), then if there are an even number of runs of 1 you will win and if there are an odd number of runs of 1 you will lose. The only options available to you and your opponent are to take 1 of the remaining runs of 1 – which one you pick makes no difference.
I wanted to see if there were general trends I could work out from working through all the moves in all the games. Unfortunately, I couldn’t see one (although there might be one that I couldn’t see). I think that there are two complications to finding trends:
- There is one set of shared pieces, rather than each player having their own set of pieces as in chess, Go, draughts etc.
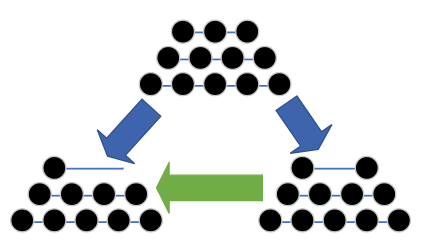
- Consider the different ways a player could take 2 or more counters off the board, and what state the board would be in for their opponent as a result. If they did almost the same move, but took 1 or more fewer counters, and then their opponent took the remaining counters from the ‘original’ version of the move, the game will be in the same state it was in the original version of the move, but now whose turn it is has swapped.
To illustrate the last one, consider player A making the moves represented by blue arrows below, and player B making moves represented by green arrows. If we are at the start of the game, A could take 2 of the counters from the shortest line, leaving 1 on that line and it is now B’s turn. If instead A takes only 1 of the counters from the shortest line, B could then also take 1 of the counters from the shortest line and we are back where we were before, but now it’s A’s turn again and not B’s.
The 101 possible states that the board could be in form a graph (a graph like a tangled family tree, rather than a graph showing a value changing over time). I tried visualising this graph using GraphViz, and while the results are impressive I’m not sure they’re useful. (If I had labelled the arrows with which move each represented, it would show the finite state machine for Nim.)

I thought that it might be clearer to represent the relationship between states using a connections matrix. This is a table with all possible states as both rows and columns, where the rows show which state you’re in now, and columns show which state or states you can move to from that state. A cell for a particular (from state, to state) pair is filled in if it’s possible to make the corresponding change between states. It’s a bit clearer than the blobs and arrows diagram.

The longest diagonal line from top left to bottom right being clear shows that there’s no state where you can end up back there after making a move (you can’t go from the state to itself). The fact that the bottom left triangle in the table is clear shows that moves are one way – being able to move from state A to state B doesn’t mean that you can move from B to A as well.
I wanted to see if some moves were better than others. I looked at all the games, and saw if the first player won or lost (by seeing if the number of moves in the game was odd or even). I then went back through graph of states and tagged each move (each arrow) with the number of times playing that move leads to you winning or losing. From that I calculated the win percentage for each move (the number of wins as a fraction of the total games, regardless of outcome). I then looked across all the moves to see the range of win percentages (rounding to the nearest whole number), and how common the different win percentages are. I removed moves that had a 0% or 100% win percentage because I didn’t think they were helpful.

The graph shows that most moves have only a 50% or 51% chance of leading to you winning, which fits with my experience of playing the game against someone who knows what they’re doing.
Some notes about the code
As I mentioned earlier, once I had worked out a good, i.e. simple, way of modelling the game and moves, the code was simple to make.
It starts with knowing only one state – 11100. It has a to do list of states it hasn’t considered yet, which also starts as just 11100. It repeatedly takes a state off the to do list, and tries applying all the moves. Some are invalid because they say to e.g. take from the run of 5 counters when this has already been removed by a previous move. The valid moves will lead to new states. Some of these states will be ones we’ve seen before, but others will be new. New states get added to the to do list.
The only important detail is how states are taken from the to do list. Given that it’s impossible to go from a lower-numbered state to a higher-numbered state, e.g. from 01100 to 111000, it makes sense to consider states in the order highest-numbered to lowest-numbered. This means that you know you won’t need to revisit states you’ve already considered.
This approach of processing a to do list in the order of some number reminded me of the excellent Dijkstra’s algorithm, which is used to find the shortest path through a network such as a road map. I don’t bother to sort the whole to do list, just find the state with the highest number – I don’t need to know which states are currently 7th and 8th in the list, just the 1st one. (This is quicker – it has time complexity O(n) rather than O(n * log(n).)
I looked at how big the to do list was over time – did considering a state add more to the to do list than the one state just removed? I.e. do we go backwards? How often do we find completely new states compared to states we’ve already seen?
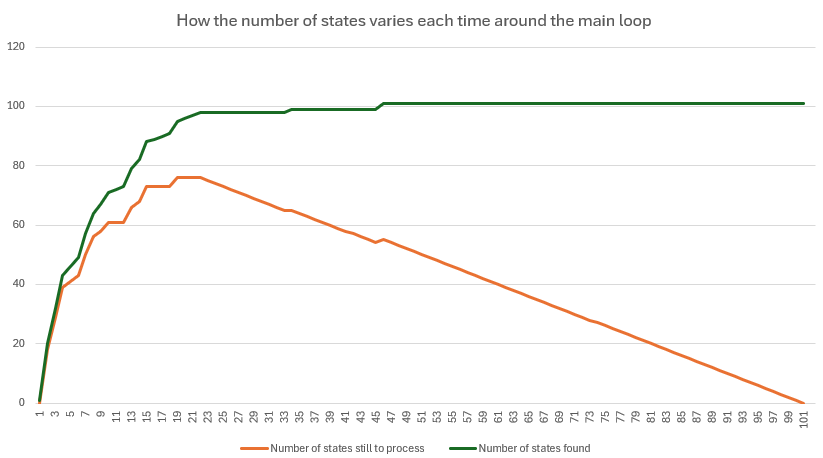
The to do list starts going backwards – each 1 state we take off the list to process means many states are found that are added to the list. Once the number of new states drops to 0, we start to make progress on the to do list. This is also reflected in the graph showing the total number of states found so far.
Conclusion
I still haven’t worked out a foolproof strategy for playing Nim! However, I think that this was a good example of how thinking about a problem in the right way can make all the difference. (Days of coding can save minutes of designing.)
Also, there can be many ways to visualise something, and sometimes you will get an impressive but useless jumble if you use the wrong technique. So having a variety of tools and knowing when to use them is a good idea.
