Introduction
Before we can get into testing, first I will explain the BI database and how it’s created.
BI is short for Business Intelligence. It can mean different things to different people, but the definition I’m going to use is some form of storing data in a way that helps people to make decisions. It could be to feed into an analytics thing like Tableau, or something that generates reports, or even some kind of machine learning thing.
I will also assume that the data doesn’t start off that way. The data could come from anywhere, e.g. files, API calls etc, but I’m going to assume that it comes from a database. By database, I mean a database that supports the running of something like an online shop, a forum etc. It’s otherwise known as an operational database, and so will generally have tables that hold a row per thing that’s important to you (user, forum thread, forum message, item in shopping cart etc.)
In between the BI and the operational database is a data processing pipeline, which turns the operational data into the BI data – filtering, denormalising, summarising etc.
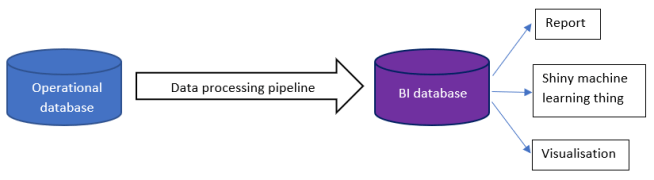
I’m not going to worry about how the data gets into the operational database, or how the BI database is used in reports, machine learning or visualisations. I am going to look at how data in the operational database is turned into data in the BI database.
Data processing pipeline as a series of steps
Instead of one single arrow as in the diagram above, the pipeline is probably a series of steps connected end-to-end. Each one reads from a set of one or more tables, processes their data in some way, and then writes the results to one or more output tables. The output tables of step X are available to be the input tables of step X+1 etc. The input tables for the first step are in the operational database, and the output tables of the last step are in the BI database.

A classical way of doing this kind of thing is with an ETL tool like Talend or SSIS. ETL stands for Extract Transform Load, which is just another way of saying Read Process Write. You could also do it in stored procedures, streaming things like Apache Spark or anything else that can read, process and write data.
For simplicity, I’m going to assume it’s something like an ETL tool or set of stored procedures. I’m also going to assume that the intermediate data is in tables in some database – I don’t really mind if it’s the BI database or a staging database in between the two other databases, but it’s probably not a good idea to clutter up the operational database with this data.
Test environment
If you have a test environment, then you can test with known data. The test environment will need to have an instance of the operational database, the BI database and all the code and tables that make up the data processing pipeline.
You can put known data in at the beginning (the operational database), get the data processing pipeline to do its thing, and test that you can get expected results out in the BI database. You can also test that you see expected data in the intermediate tables too.
A test environment lets you do all the normal testing things – work out the range of valid and invalid values for important data, and test on either side of each border between valid and invalid, etc.
Testing invariants
There’s another technique involving invariants, that can be used on a production pipeline or a test pipeline. By invariants I mean things that shouldn’t change along the pipeline. If your data is about sales orders, as you work your way along the pipeline you shouldn’t suddenly have more / fewer orders or more / less total money than when you started. The number and value of orders should be invariant. If your data is census data, then you shouldn’t gain or lose people, and so on. You need to decide what will be constant in your system, and within that what matters to you.
So, if you look at the two steps X and X+1 in the diagram above you can test:
- Are the values in A the same as the values in B?
- Are the values in B the same as the values in C?
By linking together this series of tests into an end-to-end chain, you can test that the BI database contents are correctly derived from the operational database.
It’s likely that the structure of A won’t be identical to the structure of B, because the processing that happens during X will do interesting things to the data, e.g. group by some of the columns and sum or count some other columns. So, you will need database queries on A and B that likely look different (reflecting the different structure of A and B) to extract what you hope will be the same values (e.g. total number of sales orders).
You might have a single value per invariant for A and B, e.g. total number of sales orders. However, you might be able to produce several finer-grained versions of those invariants. For instance, total number of sales orders per month of the year, per geographic region, per product line etc. This is a matter of judgment: the finer-grained you go, the more work it is to write and run, and the more space is needed to store the values; on the other hand, you can pin-point bugs more accurately.
Rejects
In step X above, it might be that not all rows in A will end up in B. For instance, there’s a table in A for sales orders that has a nullable column to store salesperson. The column is null for orders taken online, but otherwise has a foreign key that gives the id of a row in the salesperson table. The processing in X might join the order table with the salesperson table, and so this will silently drop any orders taken online. It is very easy to not realise this, but testing should expose it.
This example sounds obviously wrong, but sometimes the programmers of the pipeline made assumptions about the data that are no longer true. Or maybe the data is messy, so that it can contain what are effectively errors.
The simplest way to keep the numbers adding up is for B to have a way of explicitly storing rejects – rows in A that step X couldn’t process. If you’re checking that the value of orders is invariant, then the total value of orders in A must equal the total value of orders in the main (good data) tables in B plus the total value of rejects in B.
It’s a good place to keep an eye on – some rejects might be legitimate because you want to process messy data, but others will be from bugs in the code. Which bits of information need to be tagged onto the rejects, so you can tell bugs from messy data being correctly thrown out?
Generating documentation of the pipeline via tests
Above, I’ve been fairly hand-wavy about how you get the values of the invariants, and how you compare pairs of values for a test. This is deliberate, as it depends on your situation. However you do it, it’s worth thinking up front about how easy it is to extract extra value from the tests by using them to generate documentation with minimal extra effort.
There are at least two bits of documentation that the tests could generate:
- Which tables are the input and output tables for each step? If you string these together then you get an end-to-end view of the whole pipeline.
- Which steps are covered by tests?
Documenting the steps
The first kind of documentation will come from how you define the tests – how will you specify which tables to read from? If you can do this in a reasonably structured way, then it will be easier to extract this information for documentation. It might be good enough to simply have a text field that needs to be kept in sync with the rest of the test definition by hand – it’s not perfect but might be good enough.
For each test you will extract a list of one or more input tables, and one or more output tables. What you do with that information is up to you.
You could generate a visualisation, in something like D3, where each blob is a table and two blobs are connected if they are input/output for a given step. If you have more than two tables in total for a step, then it might be worth creating an extra blob to represent the test, and then drawing a line from the test’s blob to each table in the test. This would avoid a many-to-many mess of lines.
As you’re generating a graph, you could dump the data in a graph database like Neo4j, which would let you query the data easily. For instance: if the data in table T is bad, which are all the tables downstream of T (via one or many processing steps) that could also have bad data?
Test coverage
The approach described above will give you a list of all tables involved in the tests. It should be straightforward to get a list of all tables in the database. The difference between the two lists is interesting.
- Is it a table that is not used in the pipeline? Maybe it used to be, but then the pipeline changed, and the table has been forgotten about. Can it be removed? Should it be removed?
- Is it a table that is used in the pipeline? Either the way of generating tests’ documentation is wrong, or there’s a test missing.
Trading off size and number of steps in the pipeline
The operational and BI databases represent a gap of a given size. You have a choice to fill that gap with a small number of big steps, or more smaller steps. There is no right or wrong answer, because there are costs and benefits to weigh up.
If you have fewer steps, by making them more complex:
- You need fewer intermediate tables (for N fence panels you need N+1 fence posts). The fewer tables you have, then the smaller your database will be.
- It is possible that fewer steps will run faster than more steps, but this depends on the details of how the data needs processing.
If you have more steps, by making them simpler:
- It will probably be easier to test each step, which will increase your confidence that the final result is sound.
- If there is a bug in production code, then you will have more data that you can keep, and hence less data that you need to re-generate once the bug is fixed. If you make a single big leap, then all of that will have to be rewound and then done again. If the same distance is covered in a series of smaller steps, it’s only the small wrong step (and onwards) that needs rewinding and redoing.
- Smaller steps will be easier to understand, and hence debug and change in the future.
- You will get richer documentation generated from the techniques described above.
Summary
It is possible to test data processing for BI databases, whether you have access to a test environment or not. As with other kinds of code, there are questions of designing for testability. If you design your test framework carefully, then the tests can provide helpful documentation about the data processing and their own quality.
